
-
Which chart types used to display summary values from two different levels of grouping in reports?
Which chart types used to display summary values from two different levels of grouping in reports?

Log In to reply.

Popular Salesforce Blogs

Salesforce Sales Cloud: Implementation and Adjusting, Customization
What to do if you implement a costly CRM, and find out it cannot cover all your business processes? If you are a business owner…


The Power of Picklists in Salesforce
Enhancing Data Consistency and Efficiency: The Power of Picklists in Salesforce In the dynamic realm of customer relationship management (CRM), precision and organization are paramount.…


Welcome to Our Salesforce CPQ Video Series!
Video 1: Intro to Managing Your Subscription Products with Salesforce CPQ: Salesforce CPQ is a great tool for managing complex sales quoting processes and creating professional output documents.…

Popular Salesforce Videos

How to Create Custom Field in Lighting Experience | Salesforce
Fields you create on standard or custom objects are called custom fields. You can create a custom field on the Contact object to store your…

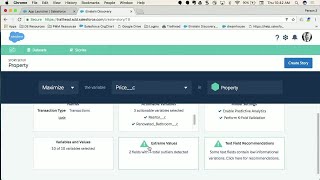
Add Intelligence to Any Salesforce App with Einstein Discovery
Bring intelligence in the context on any Force.com app thanks to the power of Einstein Data Discovery. Any Salesforce Admin or Developer can add in…


How to Create a Jira Ticket from Salesforce?
Learn how to create a Jira ticket in Salesforce using two different methods and how to choose a Jira project. Know more at https://www.sinergify.com/
